People & the Environment: Geo-analytical Guidelines and Software Tools for Measuring Interaction and Experience with the Built Environment
Garrett C. Millar
Harvard School of Public Health
September 2019
Hi everyone, and thank you for coming today. A special thank you to Dr. Peter James for inviting and organizing this talk.
My name is Garrett Millar, I'm a PhD student in Geospatial Analytics at North Carolina State University. Geospatial Analytics--the science of WHERE things HAPPEN.
I'm here today to talk with you all about People & the Environment. Well, that could mean just about anything right? So more specifically, we'll be looking at ways to measure and also map how people interact with the environment.
To do so, we'll go over different geo-analytical guidelines, techniques, and software tools, for empirically measuring people's environmental interaction and experience.
LETS GET STARTED!!
In our daily comings and goings between home, work and school, the streets and bike paths we choose to navigate are also an emotional map of our commute.
Where do we consistently experience frustration with traffic?
Or anxiety from a tricky intersection?
I believe questions such as these are becoming more and more important to ask
Mainly because the ways we now get around town, or go to and from work and school, continue to become more diverse, and more popular:
skateboarding
mopeds
biking
walking
electric scooters
Questions such as places where we find ourselves consistently getting stressed, or always feel more at ease are the ones we'll be asking, exploring, and hopefully answering together today.
And if some of you are able to walk away with some answers to these questions, then I'll consider today's presentation a success :D
So what I'll particularly be talking about today is how mapping the locations of strong emotions can help improve the human experience
Specifically because it can help decision-makers (urban / city planners) identify where environments inspire either calm or stress.
But before we get into that, let's start from the very, very top, by asking some overarching questions:
why emotions?
and why would we want to try and map them?
Well, emotions play a major role in our day-to-day lives, as they play a large part in how we perceive and experience the world.
People can experience a wide range of different emotions, but usually depend on the context, or the place, in which they are experienced.
In fact, emotions are nothing more than a physiological response to some sort of stimuli, which tend to arise from our environment.
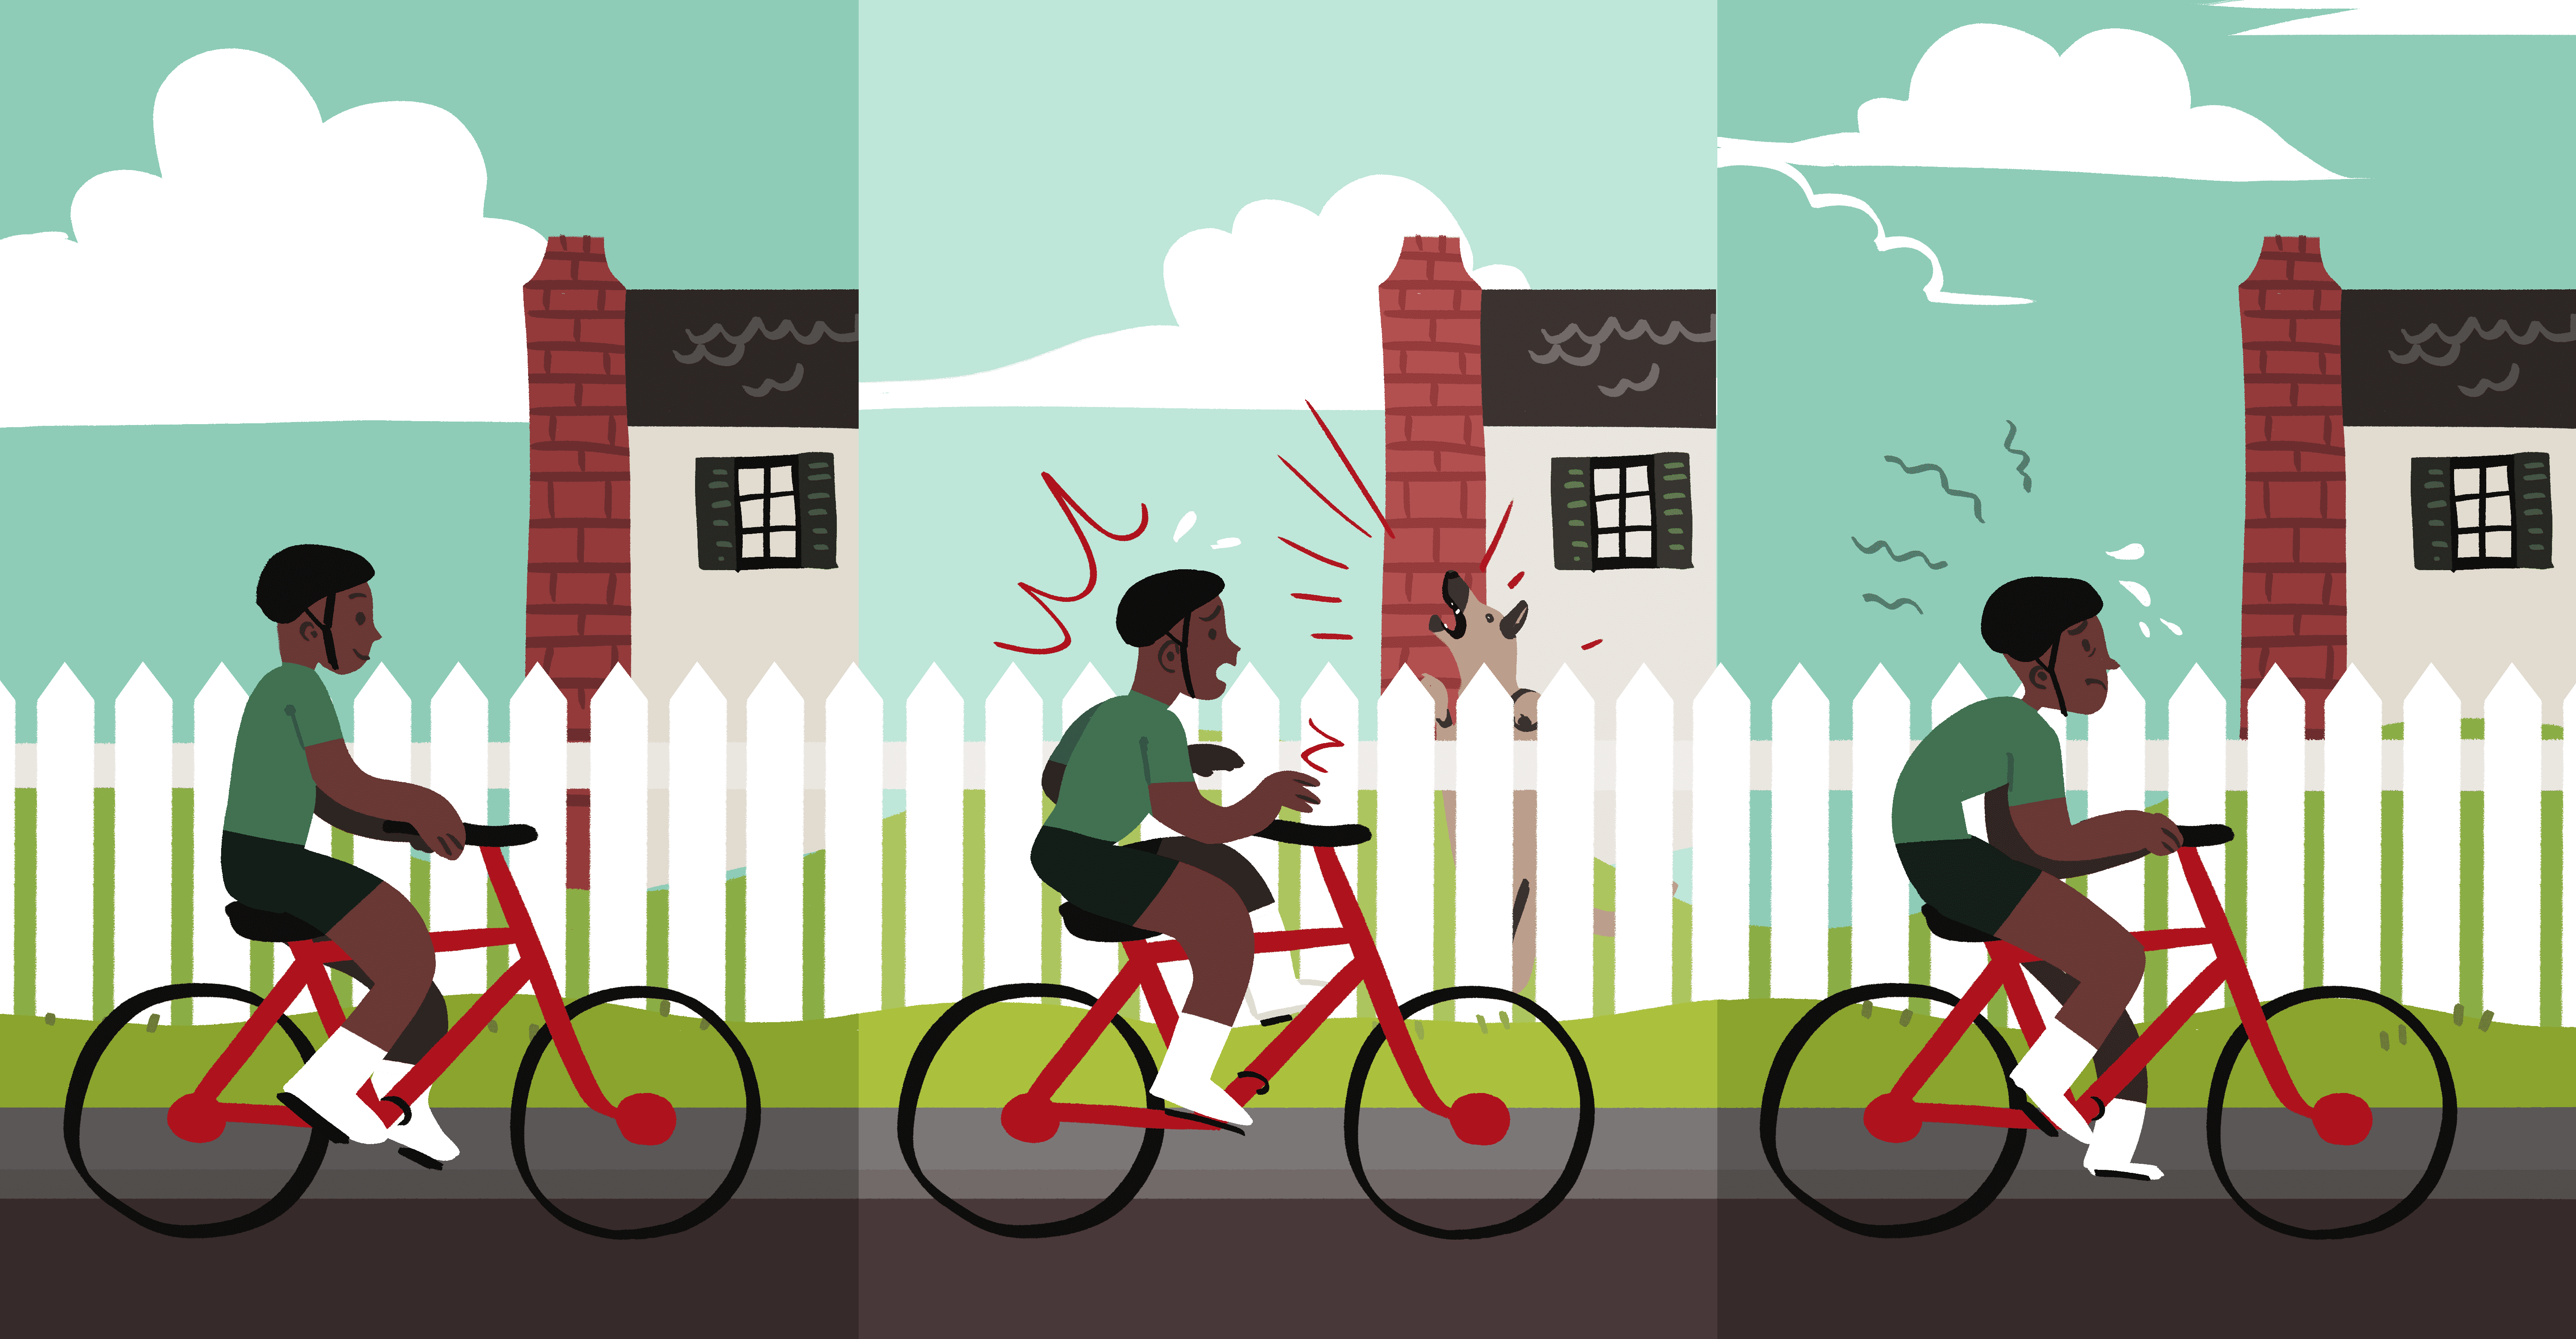
Take for example whats being shown to you now. That is, a dog just trying to be friendly and say hello, but accidentally scares an unsuspecting cyclist passing by the dog's yard. I can promise the dog didn't mean to scare him, he's a good boy.
The good boy, an external stimulus in the environment, barks, scares the cyclist (an initial physiological response), who is then stressed (emotion) following the encounter.
So, we need to not only have a way to look at what people are feeling not just in general, but EXACTLY where they are feeling it, so we can not only understand how we interact with our environment, but also understand and optimize our emotional and physical well-being.
But, this apparent physiological response to a stimulus, would need to be measured in order to do so. So how would we go about that?
What is skin conductance?
Well, human emotion is a very complex phenomenon, and is extremely hard to pin down.
Fortunately, there are physiological indicators that our bodies exhibit which can be used to infer whether or not someone is feeling an emotion in the first place.
To break it down step by step:
What is skin conductance?
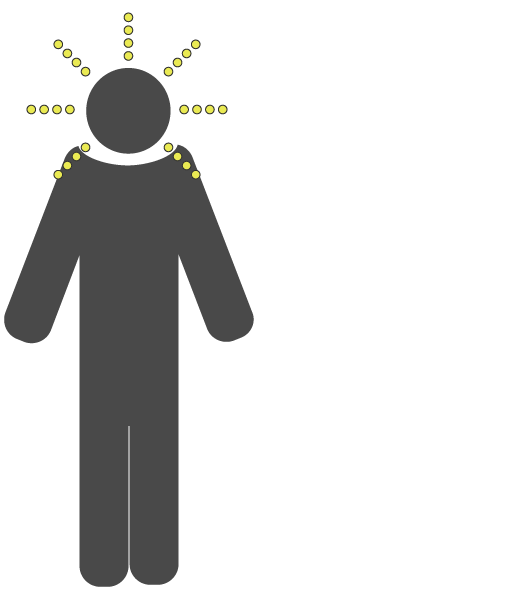
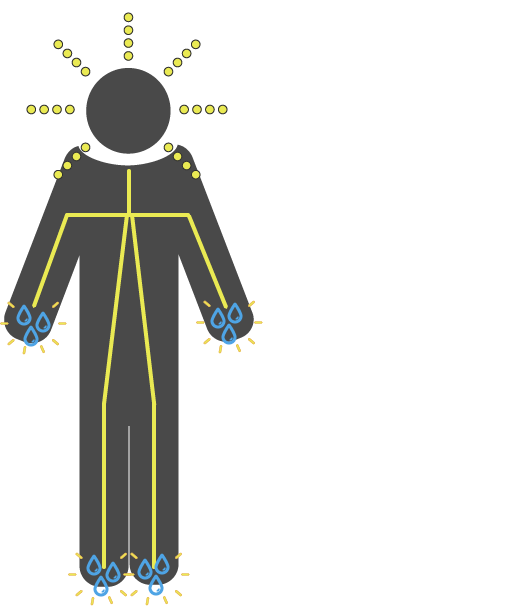
Brain senses emotion
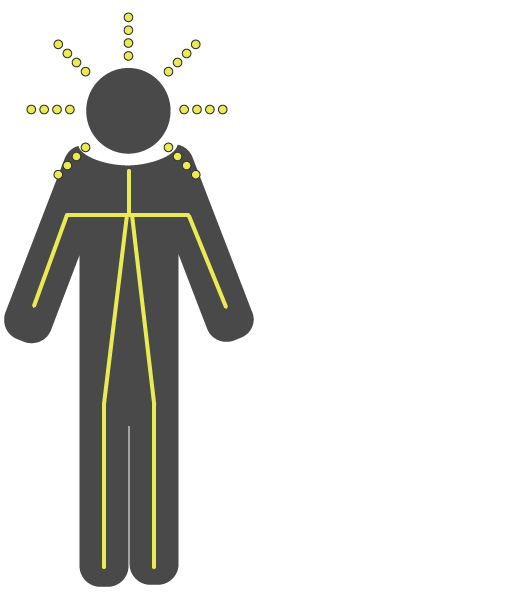
Nervous system triggers sweat glands on hands and feet
Well, human emotion is a very complex phenomenon, and is extremely hard to pin down.
Fortunately, there are physiological indicators that our bodies exhibit which can be used to infer whether or not someone is feeling an emotion in the first place.
To break it down step by step:
Brain senses emotion
Nervous system triggers sweat glands on hands and feet
What is skin conductance?
Brain senses emotion
Nervous system triggers sweat glands on hands and feet
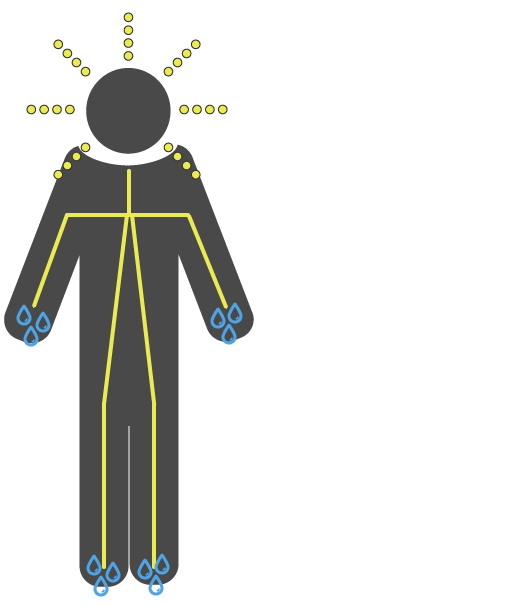
Hands and feet become slightly wetter
Well, human emotion is a very complex phenomenon, and is extremely hard to pin down.
Fortunately, there are physiological indicators that our bodies exhibit which can be used to infer whether or not someone is feeling an emotion in the first place.
To break it down step by step:
Brain senses emotion
Nervous system triggers sweat glands on hands and feet
Hands and feet become slightly wetter
What is skin conductance?
Brain senses emotion
Nervous system triggers sweat glands on hands and feet
Hands and feet become slightly wetter
Water conducts electricity
Well, human emotion is a very complex phenomenon, and is extremely hard to pin down.
Fortunately, there are physiological indicators that our bodies exhibit which can be used to infer whether or not someone is feeling an emotion in the first place.
To break it down step by step:
Brain senses emotion
Nervous system triggers sweat glands on hands and feet
Hands and feet become slightly wetter
Water conducts electricity
What is skin conductance?
Brain senses emotion
Nervous system triggers sweat glands on hands and feet
Hands and feet become slightly wetter
Water conducts electricity
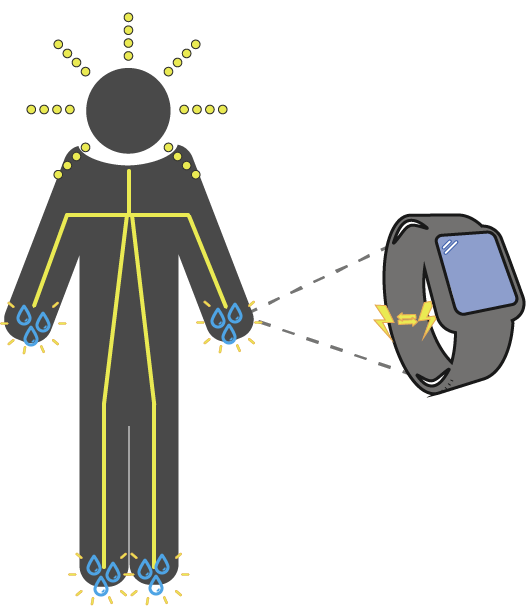
Electric current gets passed between two electrodes (conductivity)
Well, human emotion is a very complex phenomenon, and is extremely hard to pin down.
Fortunately, there are physiological indicators that our bodies exhibit which can be used to infer whether or not someone is feeling an emotion in the first place.
To break it down step by step:
Brain senses emotion
Nervous system triggers sweat glands on hands and feet
Hands and feet become slightly wetter
Water conducts electricity
Electric current gets passed between two electrodes (conductivity)
Then, technology like the Empatica E4, a wrist worn wearable specifically designed to measure skin conductance, uses two active electrodes on the bottom of the wrist to measure changes in people’s skin conductivity (or electric currents).
Why map emotion?
Now that we know how it can be measured, why would we want to try mapping it?
Well, remember, our good boy from earlier. [CLICK]
He accidentally scared the cyclist when passing the yard. The cyclist was of course initially scared, but he also continued to feel uneasy afterward.
Not only can someone continue to be stressed following a stressful event, but research also shows that if the cyclist takes that route in the future, and remembers the dog ahead of time, he will start to become stressed even before passing by the yard.
Just knowing a stressful event is going to occur will affect someone's stress levels before experiencing the event (anticipatory stress).
This is where the context of where people experience emotion starts to get a bit foggy.
If someone can be stressed before, during, AND after experiencing a stressor in the environment, how in the world can we identify and locate the stress's true source?
This is where traditional data, analytics, and visualizations fall short. They just can't match this needed level of spatial specificity and contextual clarity.
To sum this all up, human emotion is a very complex phenomenon and extremely hard to pin down and measure.
Spatial data provide a quantitative way of understanding the deeply important context of emotions, and the environmental stimuli that spark them.
However, these methods and resulting data are of course still far from perfect, so we need to consider and address certain methodological limitations when conducting research such as this.
Limitations of Wearable Sensors
Measurement quality and accuracy
Less control over environmental factors
Physiological signals can contain noise and measurement errors
BUT , all is not lost...
First, measurement quality and accuracy of mobile-sensing devices cannot compete with laboratory instruments
This is mainly due to technical constraints of battery life and physical dimensions.
Second, using mobile-sensing devices gives us researchers less control over environmental factors and stimuli our subjects are exposed to
This of course makes it very difficult isolate how stimuli are impacting participants; and this weakens the internal validity of our results
Relatedly, real-world measurements of physiological signals tend to contain noise and measurement errors, making data interpretation even more difficult
Advantages of Wearable Sensors
More objective
Continuous measurement at high temporal resolutions
Reduce burden on participants
Provide clearest window into people's daily physiology
Real-time physiological signals recorded by wearable sensors are considered more objective than self-reported assessments, which tend to be biased
Wearables allow for continuous measurement at a high temporal resolution of parts of seconds. This resolution cannot be obtained when relying on one-time measurements or self-report surveys alone.
Wearables significantly reduce the burden on participants, who are not required to repeatedly complete surveys. This makes an extended data collection period—ranging from a few hours to several months—possible.
Finally, ambulatory measurements facilitate the investigation of people’s physiological signals during their daily routines in real-life situations, offering greater ecological validity than lab studies
So, I will be showing you two cases / projects of where I've applied these concepts and methods we've been talking about, as well as what can be learned from applying these methods to each case.
then discuss how this may be applied in the future.
We first have CHIPS, a project that I've been working on to study and map the stress of cyclists while biking down a cycling highway between two cities in the Netherlands Tilburg & Waalwijk.
Then, there is Nuenen, a project measuring the emotional excitement and locations of its visitors, for both indoor, and outdoor exhibits.
I wanted to add, for both of these projects, I will be discussing the methods applied to them, without really paying much attention to particular statistical results. This is mainly for two reasons:
They are still currently being worked on.
But also, while our goal is to better understand exact environmental elements that affect human behavior and experience, evaluating them under traditional statistics is tricky.
Researchers agree that a more dynamic investigation is required, looking for tools that allow a closer and more objective examination of moment-by-monet environmental interaction and its impact on behavior and health.
These tools are what I develop, specifcially for each of these projects, and is what I'll be showing you all today
And last hopefully we have some time to talk about what all this work will look like further down the road.
To introduce ourselves to the first project, the cycling work, lets take a look at these videos. How do they make you feel? Look at the differences in the places. How do the differences in the places make you feel?
Look at these videos. How do they make you feel? Look at the differences in the places. How do the differences in the places make you feel?
Look at these videos. How do they make you feel? Look at the differences in the places. How do the differences in the places make you feel?
CHIPS: Cycle Highway Project
Participants : 12
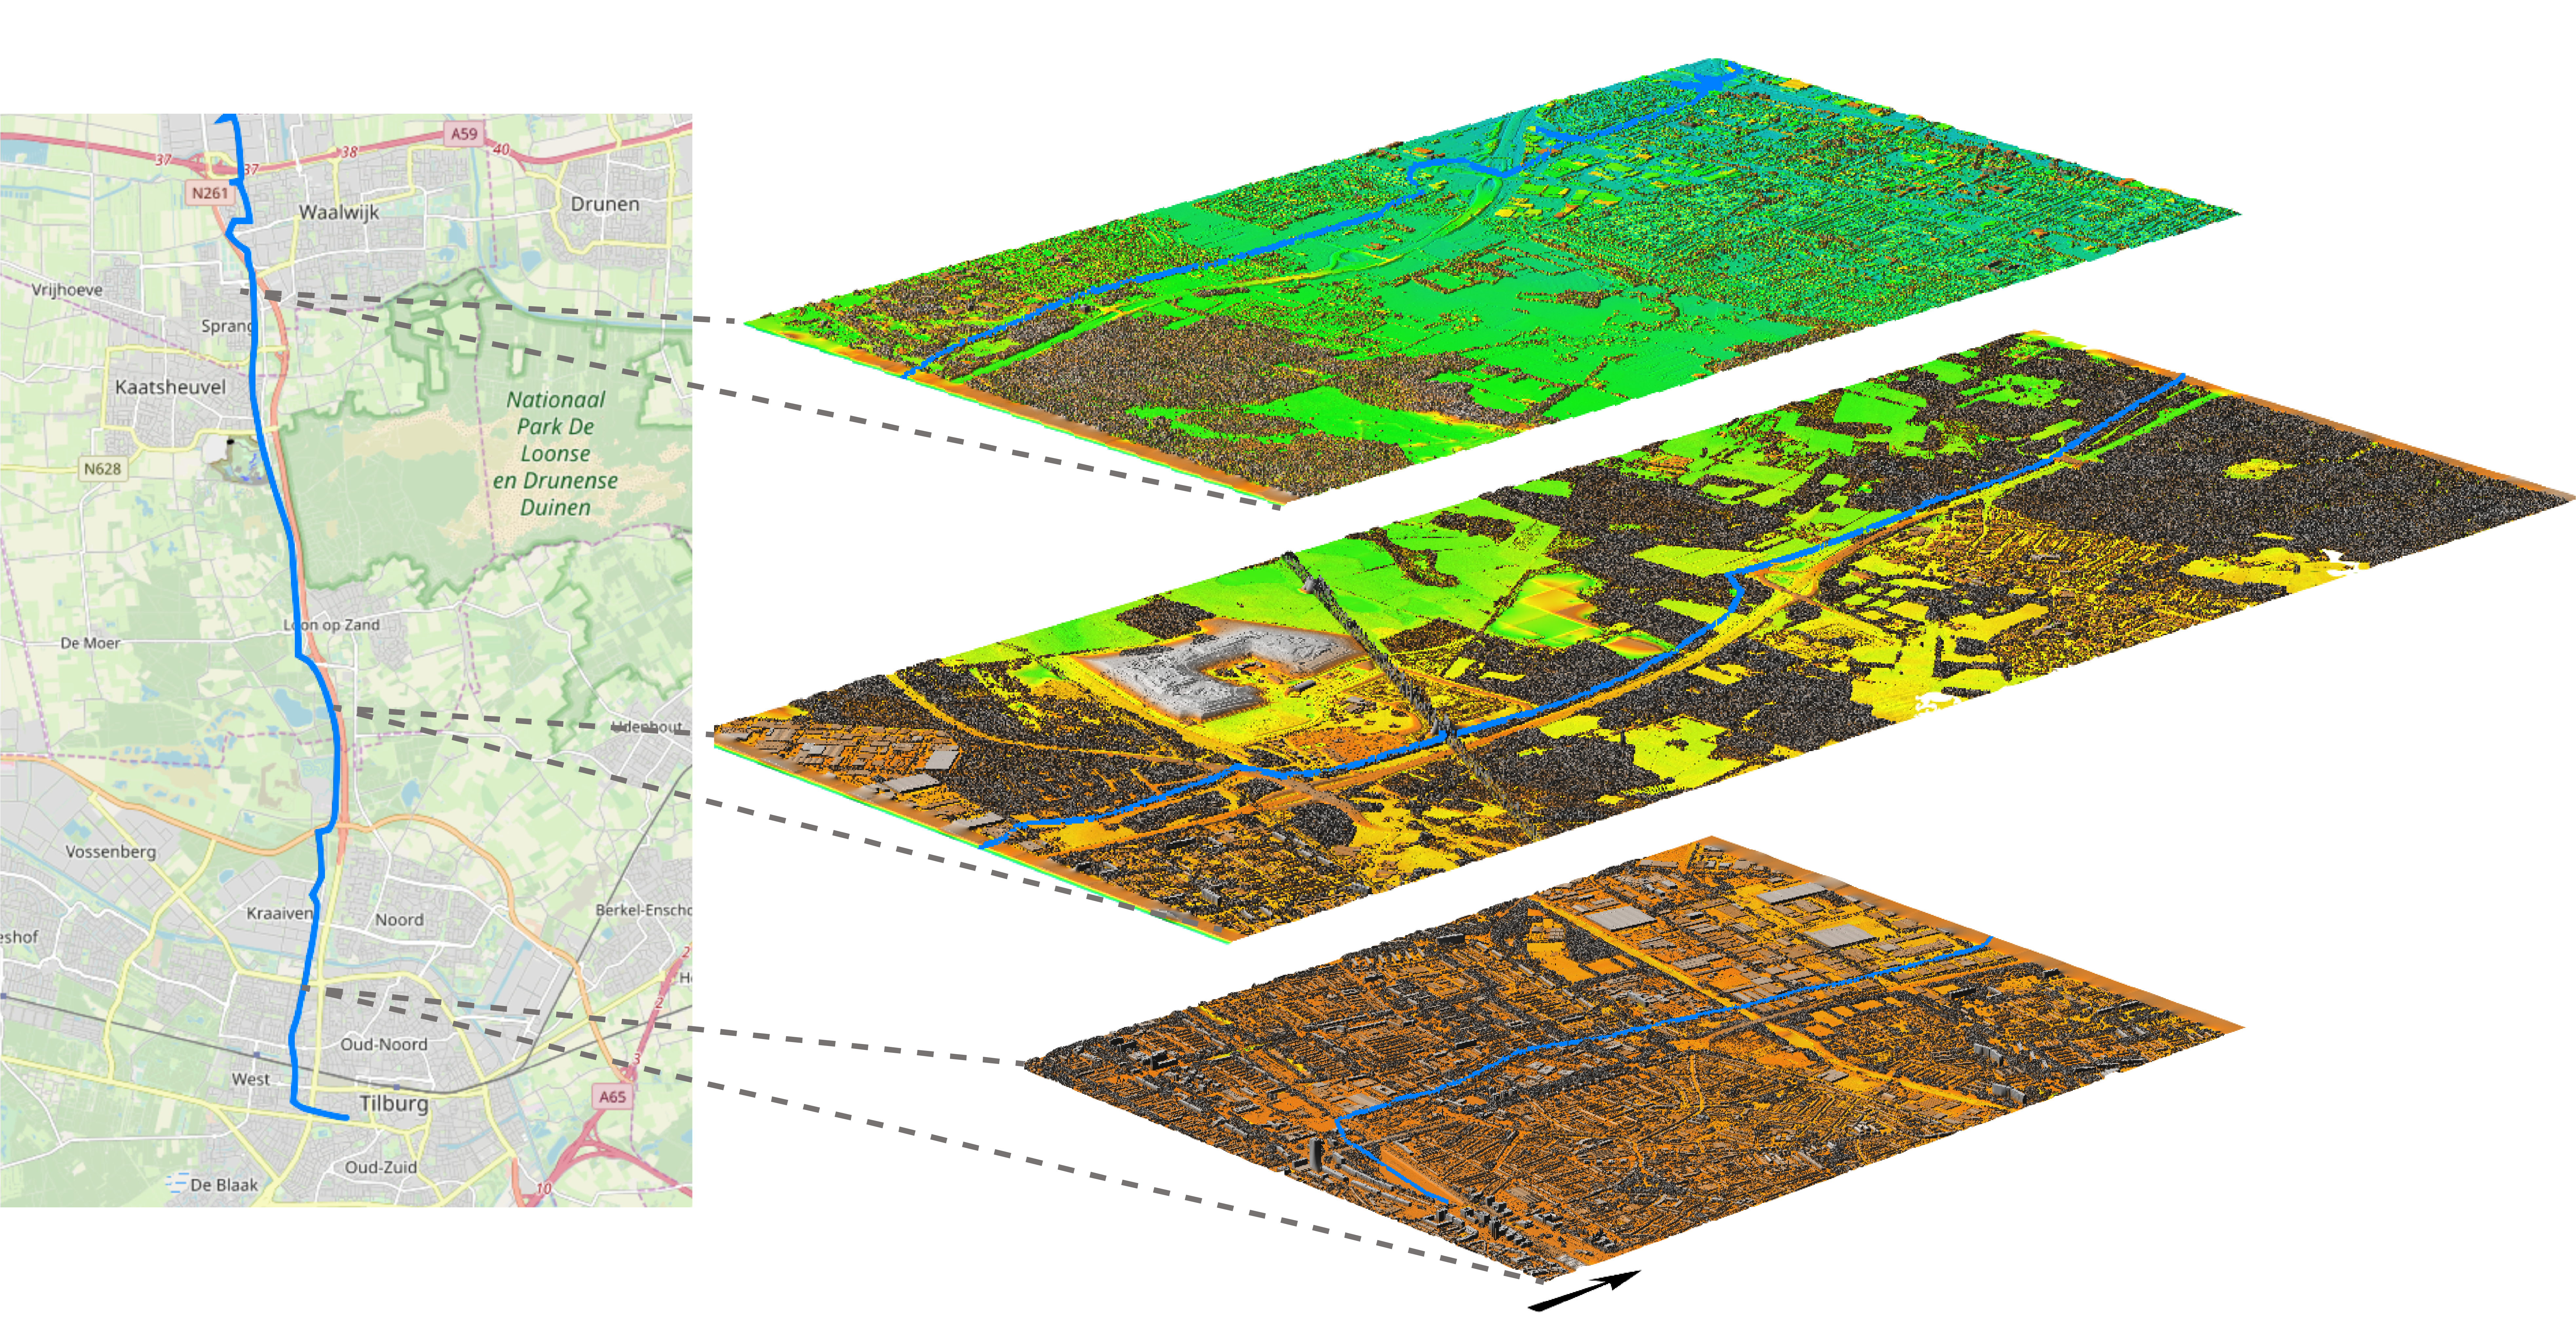
Cycle track : 18 km cycle highway
Type of bike : e-bike
CHIPS: Cycle Highways Innovation for smarter People Transport and Spatial Planning
Now my research on this topic stems from a much larger project, the CHIPS project which spans Belgium, Germany, the Netherlands and the UK.
And this project particularly involves infrastructure adaptation to increasing e-bike use.
Basically, existing cycling infrastructure is not up to the standards required by heavy e-bike use.
Just think how much faster an e-cyclist is in comparison to your standard manual bike.
Signs (directions) are too small, cycle paths cant properly account for the presence of both regular and e-bike use (e-bikes passing by fast)
And so to begin exploring how these cycle highways might be adapted to account for increasing e-bike use, researchers at Breda University of Applied Sciences ran a small study to collect some data along a cycling track between Tilburg and Waalwijk ... NEXT SLIDE
Study Area & Cycle Track
Just to quickly show what sort of cycling highway these participants biked on while their data was collected
Also note that its about a 2 hour long bike ride or so
Study Area & Cycle Track
Just to quickly show what sort of cycling highway these participants biked on while their data was collected
Also note that its about a 2 hour long bike ride or so
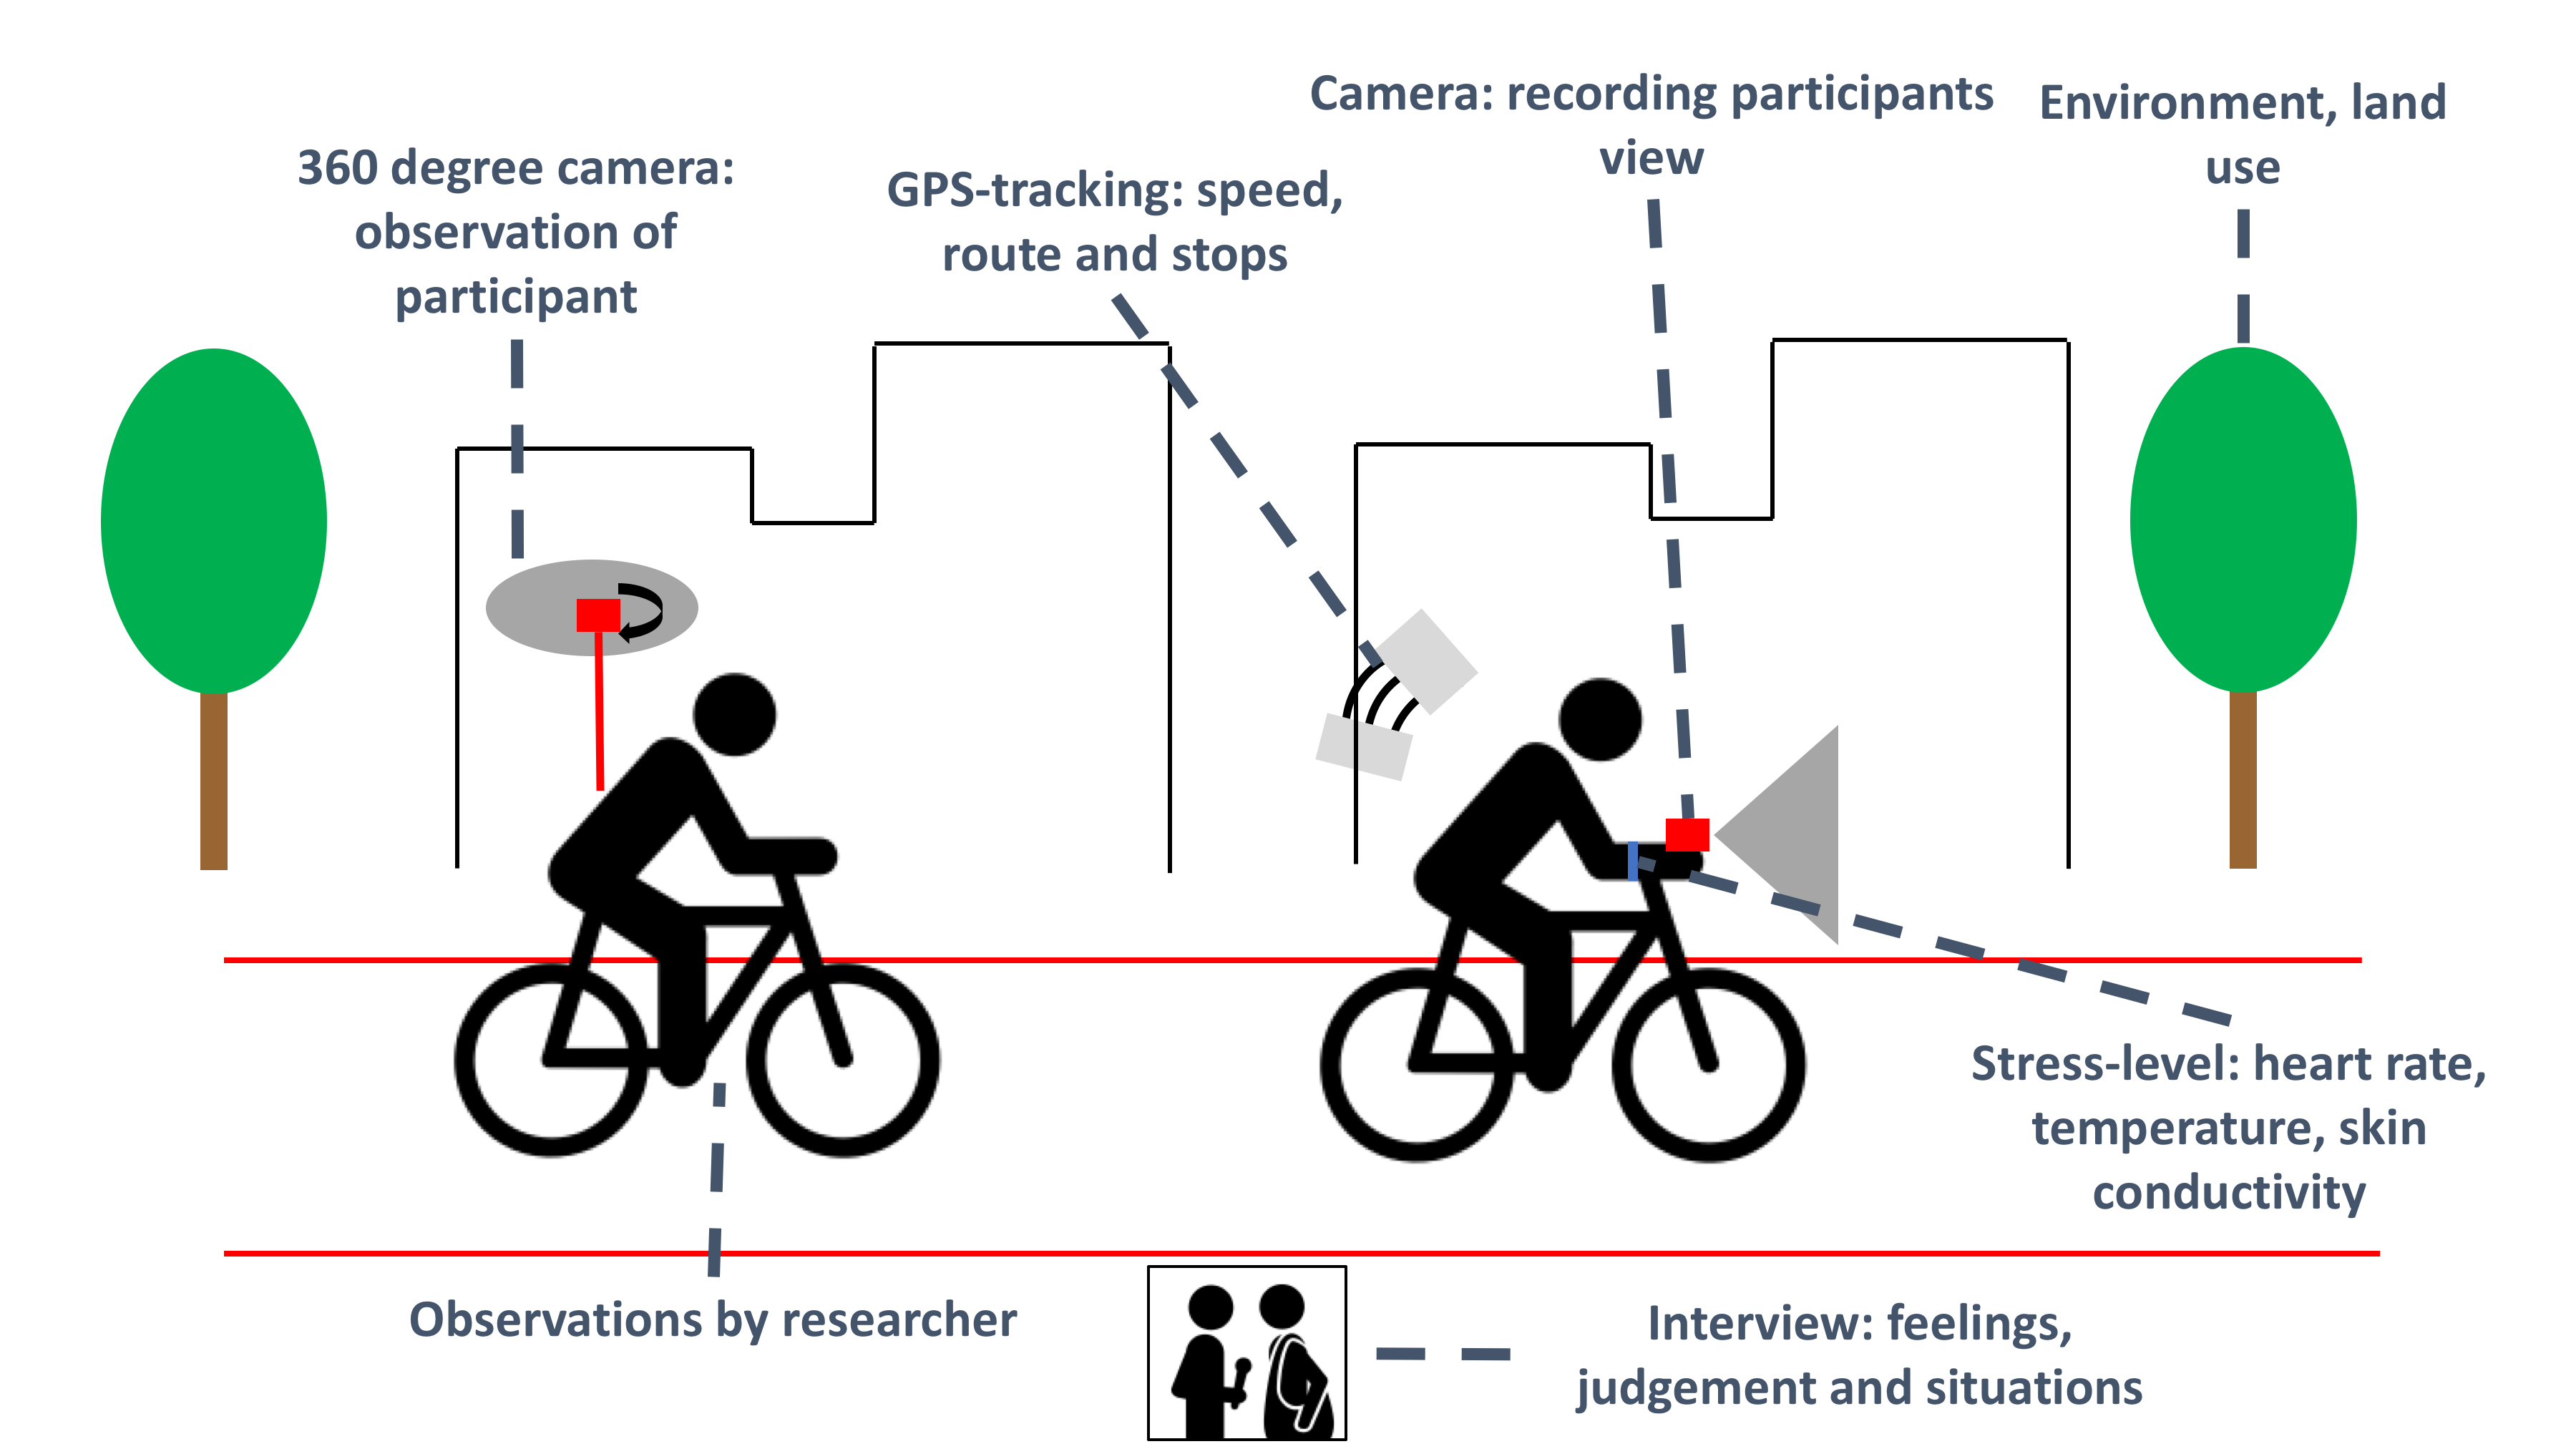
Data Collection
Credit: Lisette Hoeke | Breda University of Applied Sciences
Briefly, describe / list the data collection efforts and methods here first . . .
And this is a resulting, 1st person POV video annotated with the collected data.
Since I'm not going into detail about my analyses, I wanted to show this as a prime example for the data I have been working with, and continue to work with for publication in CEUS.
We plan to really only use these videos to verify some of my analytics (if needed)
But, these also leads to a very interesting discussion and questions to consider, ones I wanted to pose to you all:
We always think about big data as big data where we have a global datset for landcover, or an entire NC dataset at 1m resolution.
But... here in this study, we have 12 people riding a bicycle, and we have terabytes of data.
Should this be considered as another kind of geospatial big data??
Its a very different type of data because its geospatial, but you are also getting this street imagery, which, is very different from landsat
In any case, the data is availabe and there is a lot of potential to do more work on it.
Software | Interactive Application
Your browser does not support the video tag.
Geospatial Application Stress3d -
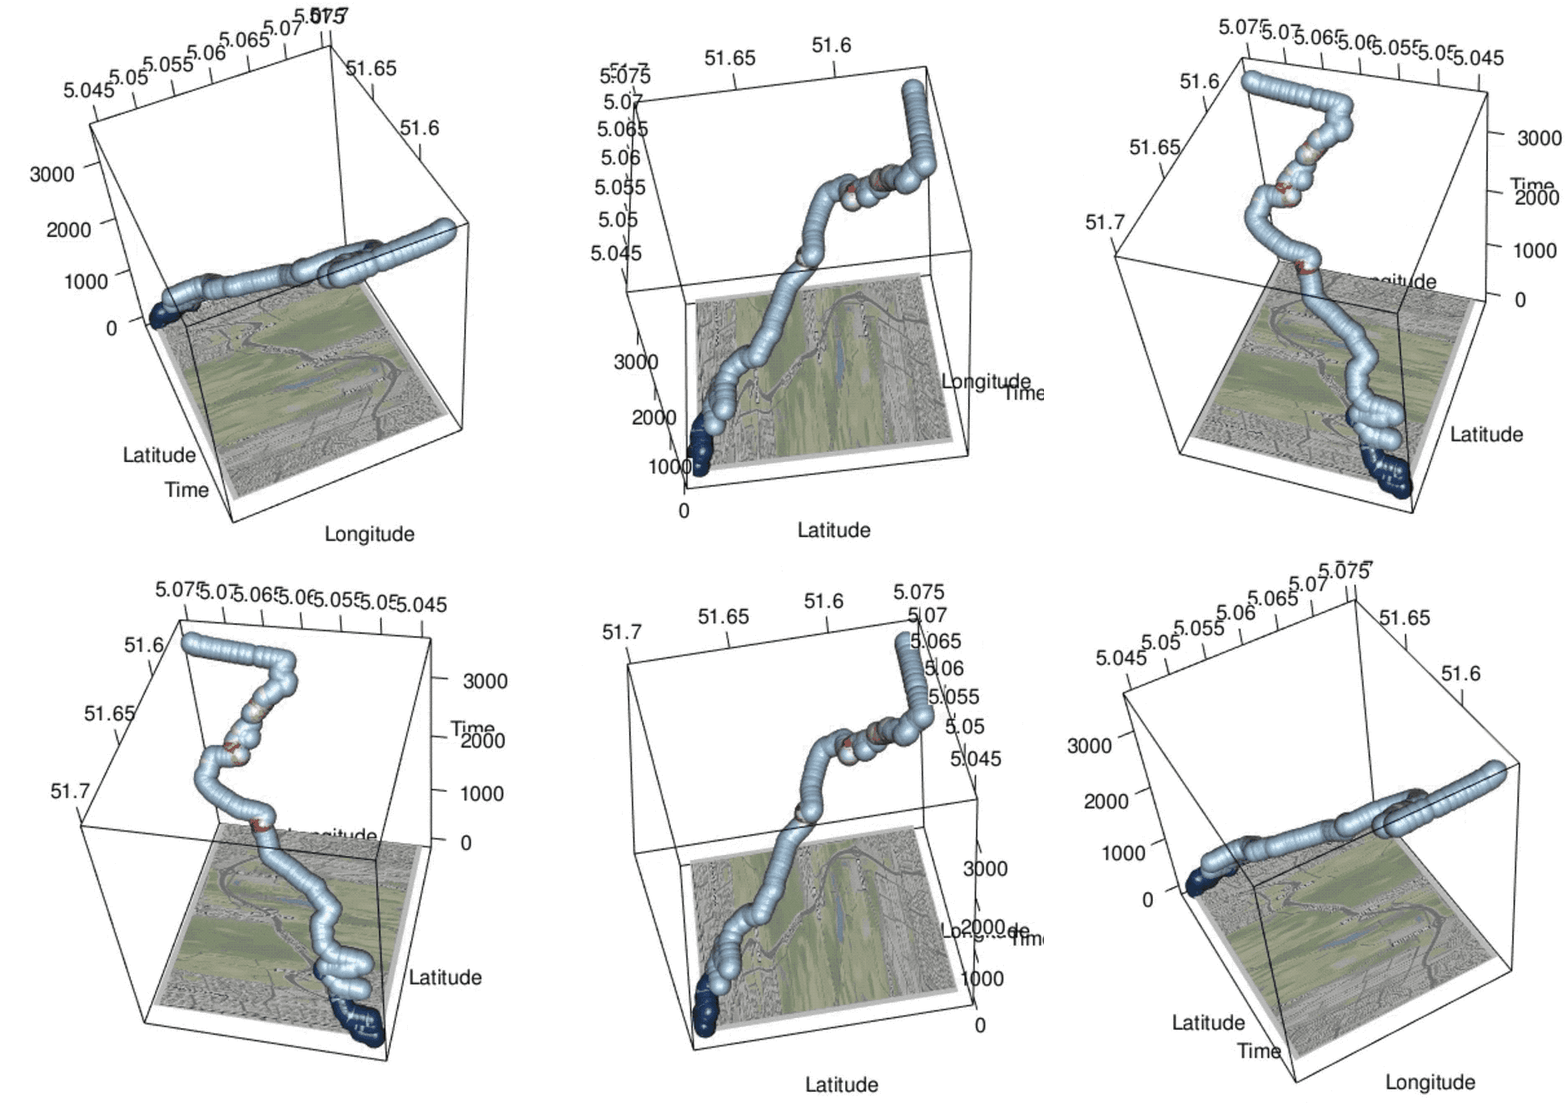
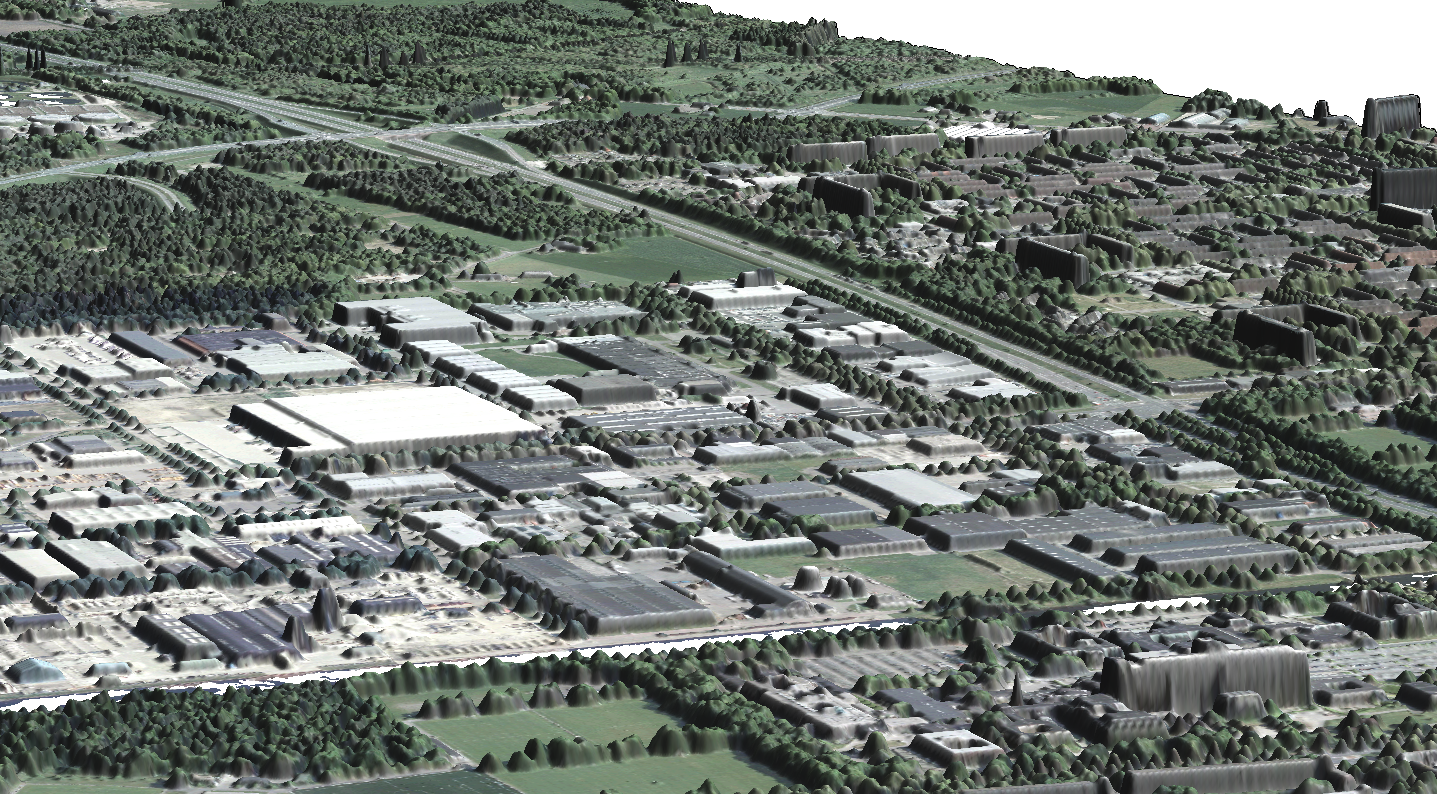
Uses cyclists' physiological data to see how stress and emotions can be affected by our environment.
As i mentioned earlier, researchers want to more dynamically investigate moment-by-monet environmental interaction and its impact on behavior and health. So, I've developed a tool that allows us to gain a closer and more objective examination.
CELTH: Storysperience Project
Participants : 16
Vincentre museum : Indoor & Outdoor Exhibits
Type of experience : Guided walking tour
This brings us to our next project in Nuenen at the Vincent Van Gogh Musuem.
Visitors' location and emotional experiences were again collected while experiencing both inside and outside exhibits at the museum. CELTH: Centre of experience, leisure, tourism, & hospitality
Study Area (Outdoors & Indoors)
The area of analysis was the new Vincent Van Gogh Centre located on the Berg in Nuenen, The Netherlands.
The Netherlands. Known as the Vincentre, in it visitors are able to discover how Vincent van Gogh lived and painted while in Nuenen.
They experience and witness his life events in two stages:
inside the Vincentre, traveling up three floors each representative of specific stages of his life; and
outside the Vincentre, visiting five outdoor exhibits by way of a walking tour. The Vincent Van Gogh Centre is currently being planned to undergo renovation.
As such, this work strives to inform the Vincentre’s directors and managers with objective information on what exhibits visitors find the most exciting and those which they do not. As a result, renovation plans can more effectively focus on exhibits that should be emphasized, and those that should be considered for alteration, respectively
Geospatial & Physiological Data
Person ID
Location (x,y)
Time (spent in location)
Skin Conductance
Direction (to & from exhibits)
Velocity
Distance to Exhibits
Viewshed (indoors & outdoors)
The ideal set of spatial and physiological data needed to examine . . .
Study Area: Outdoor Exhibits
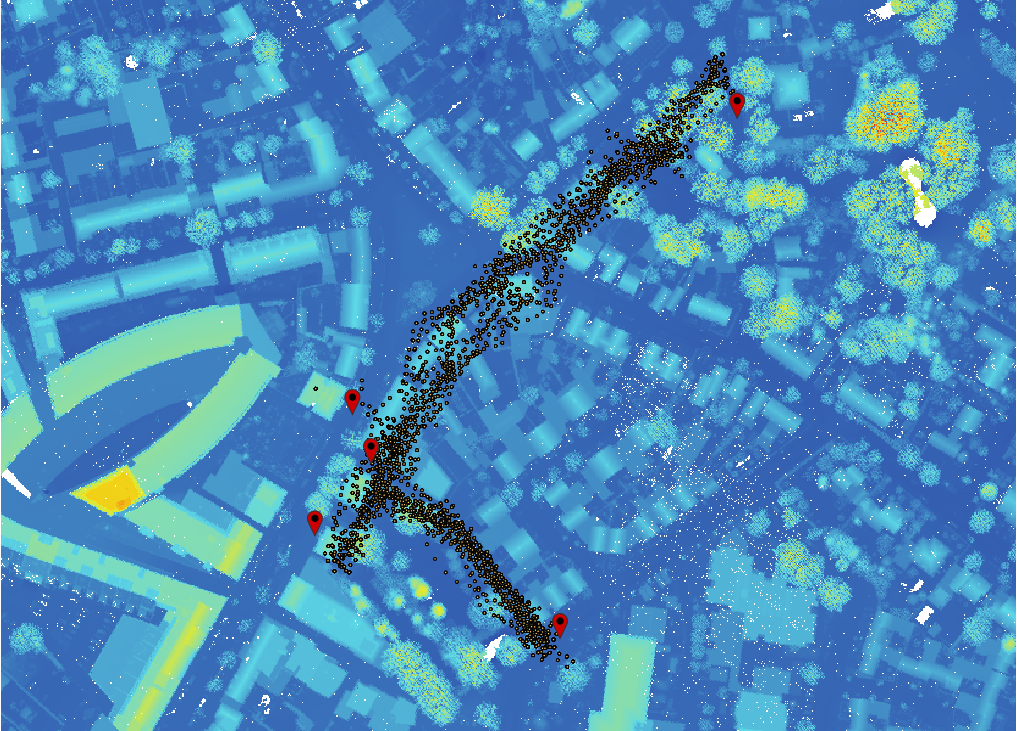
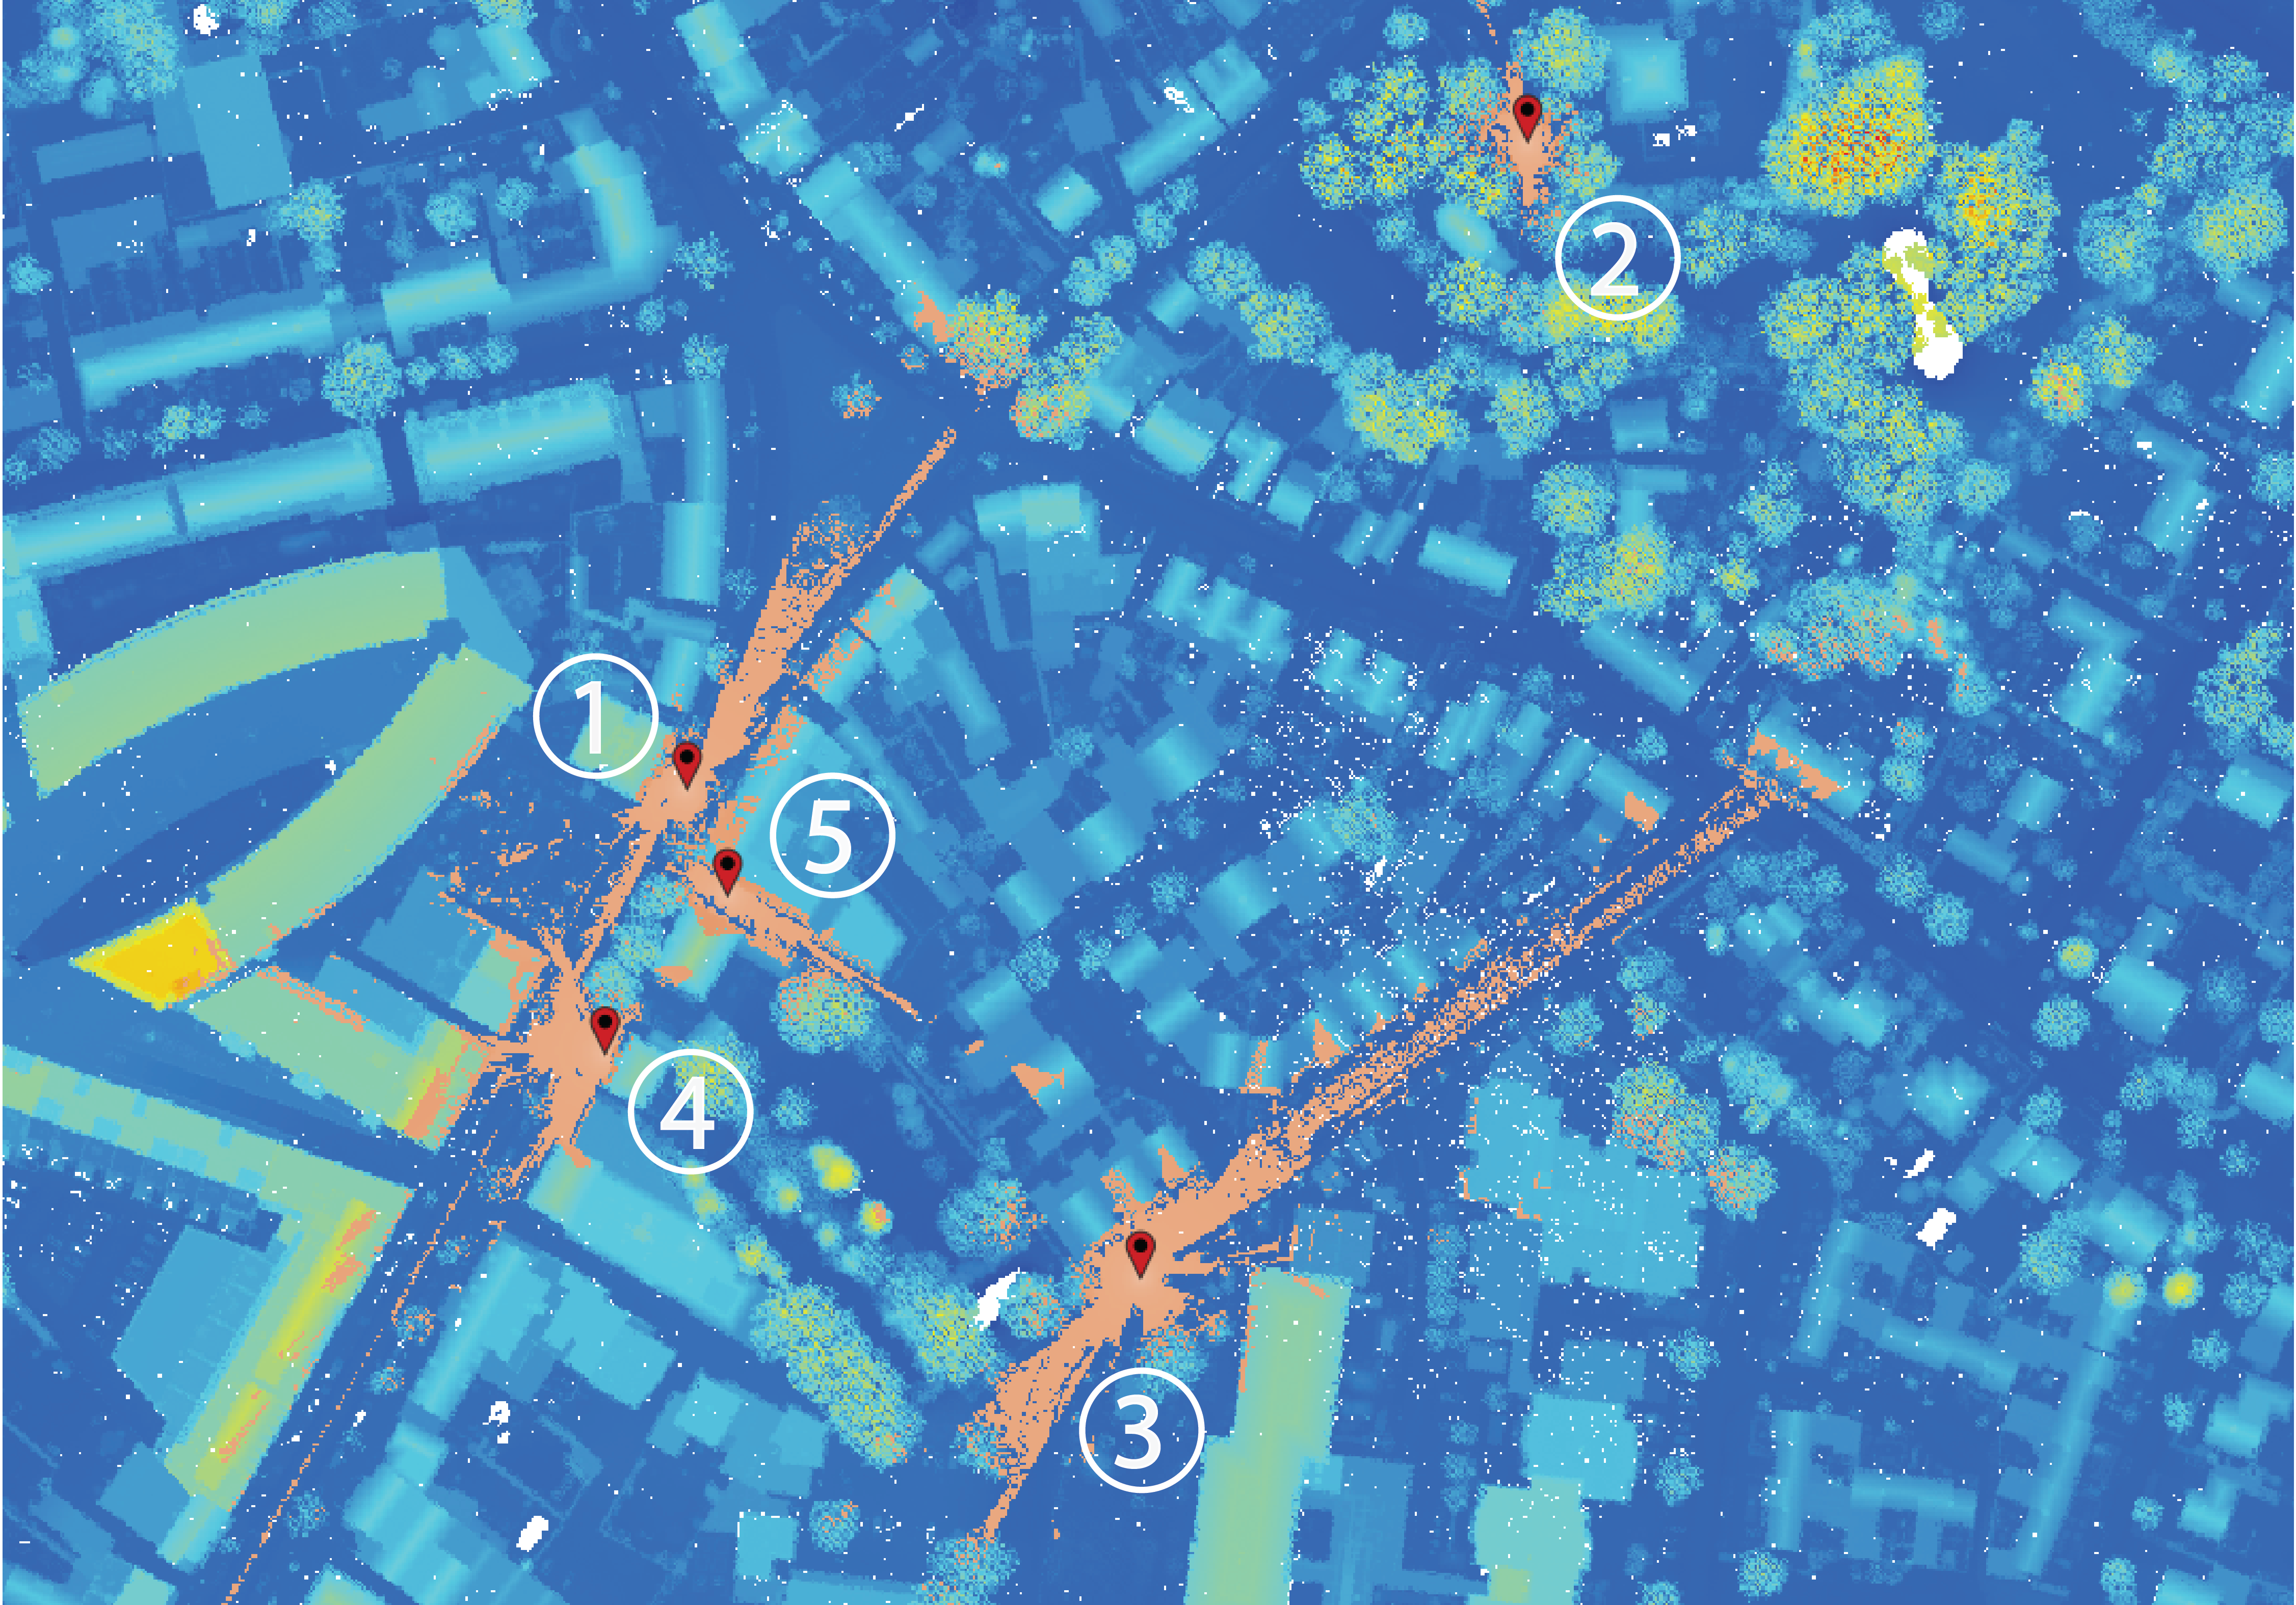
5 ourdoor exhibits, along with all participant locations recorded during guided tour
Data: Outdoors
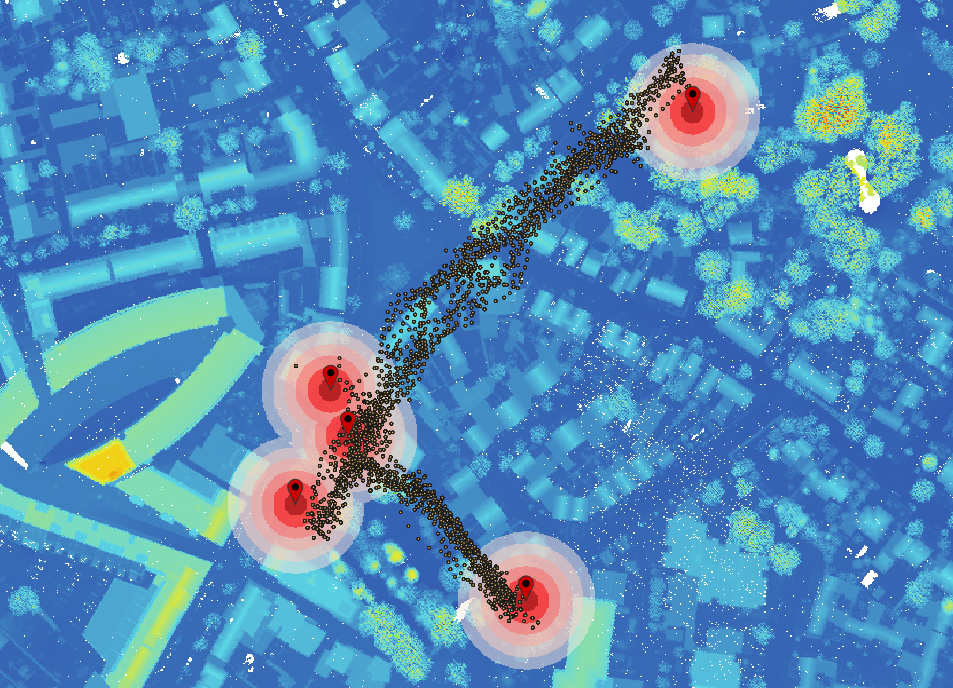
Spatially gridded maps (rasters) of some of the earlier varibles mentioned, and their mean, standard deviations, and range:
time in location
skin conductance
amount of data points sampled
Data: Outdoors
Spatially gridded (rasters) maps of some of the earlier varibles mentioned, and their mean, standard deviations, and range:
time in location
skin conductance
amount of data points sampled
Data: Outdoors
Spatially gridded maps (rasters) of some of the earlier varibles mentioned, and their mean, standard deviations, and range:
time in location
skin conductance
amount of data points sampled
Data: Outdoors
Spatially gridded maps (rasters) of some of the earlier varibles mentioned, and their mean, standard deviations, and range:
time in location
skin conductance
amount of data points sampled
First Approach: Growing Exhibit Areas
Gives you: distance from exhibits as associated with emotion response.
Second Approach: Viewsheds
Gives you: people's actual experience of museum and exhibits (line of sight)
Results
distance to exhibits results / graphs
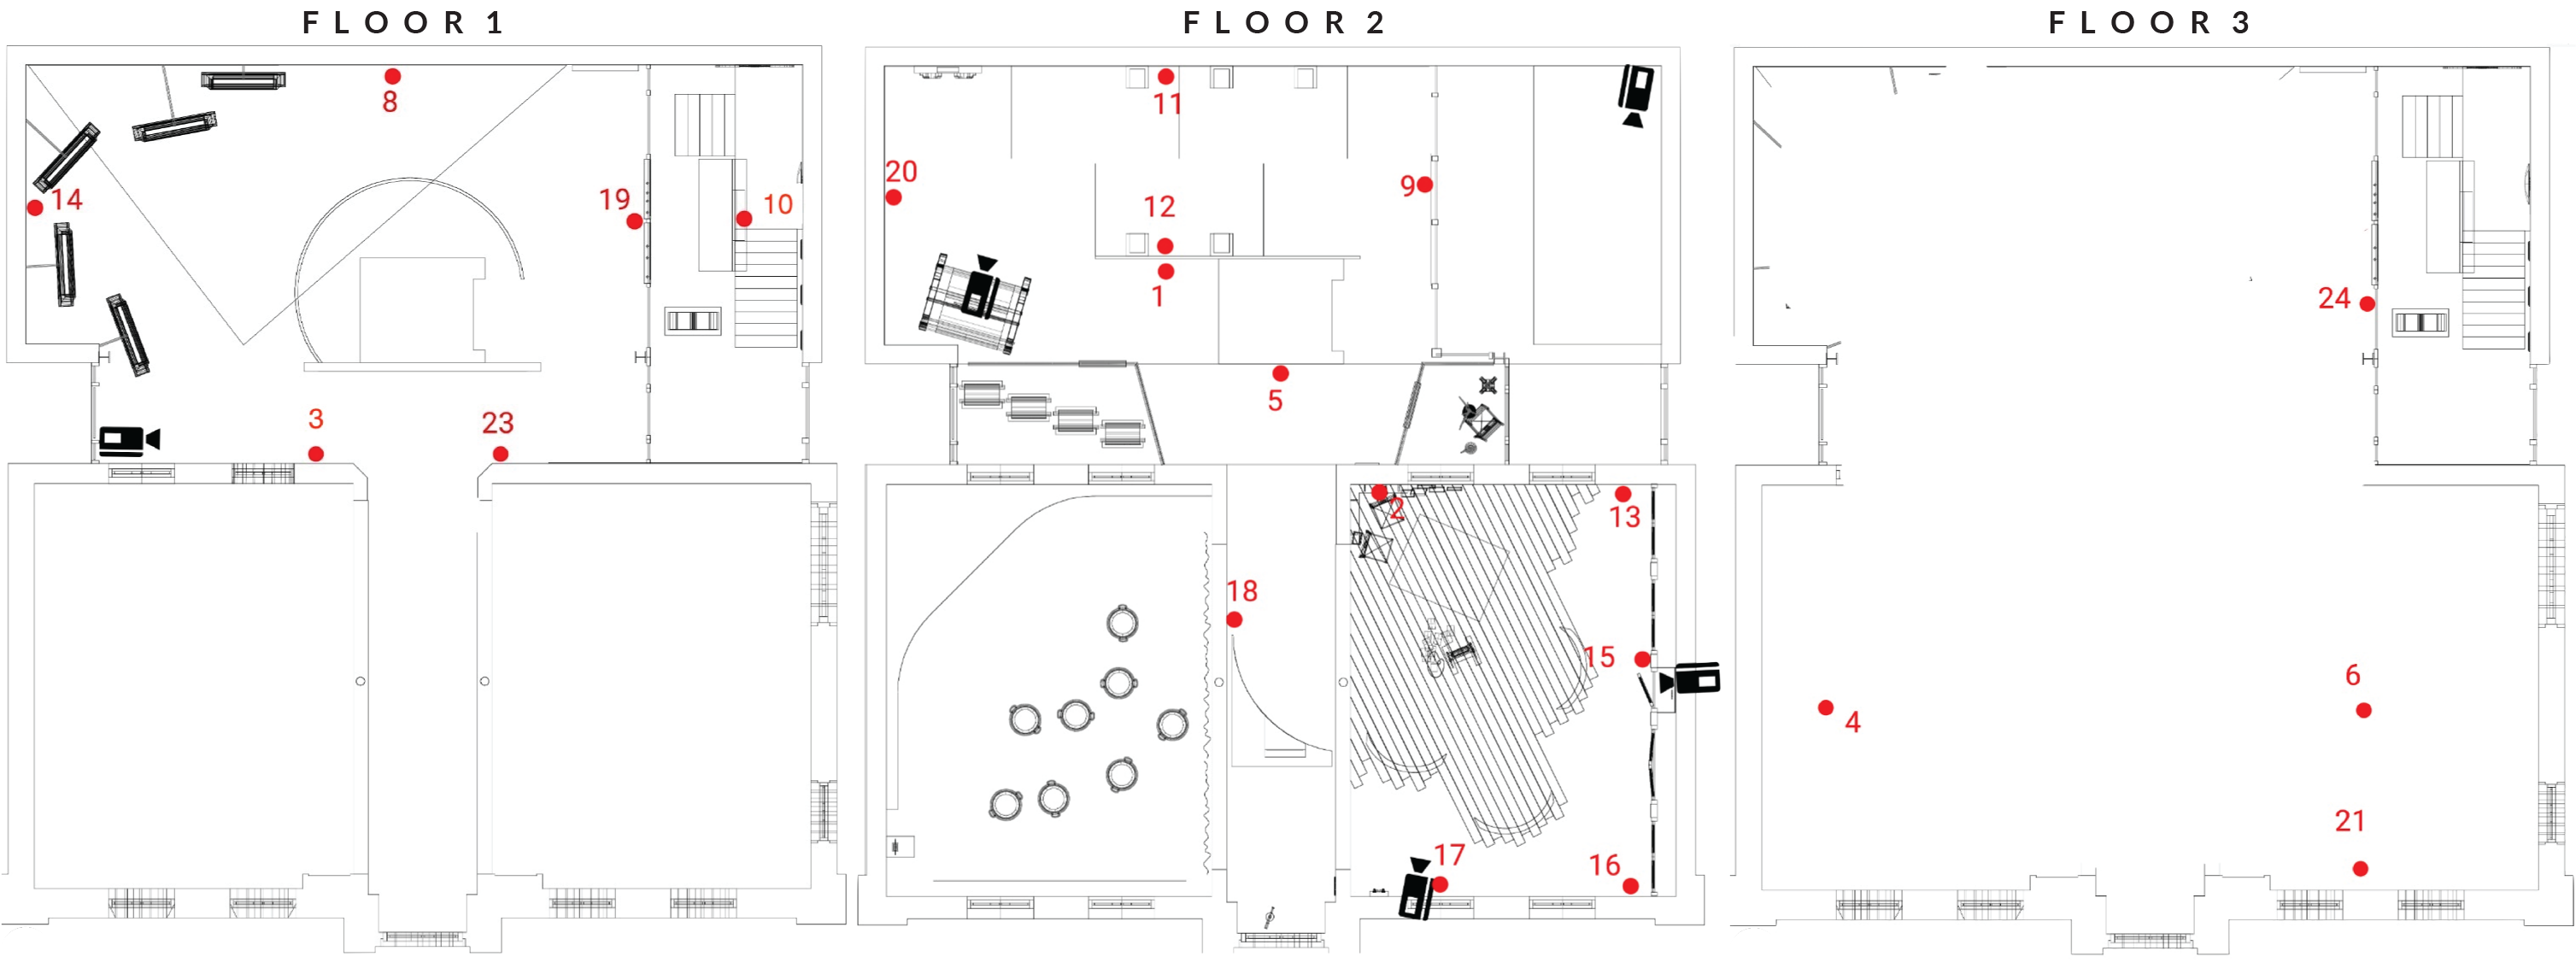
Indoors: Trilaterating Participant Locations
Indoors: Trilaterating Participant Locations
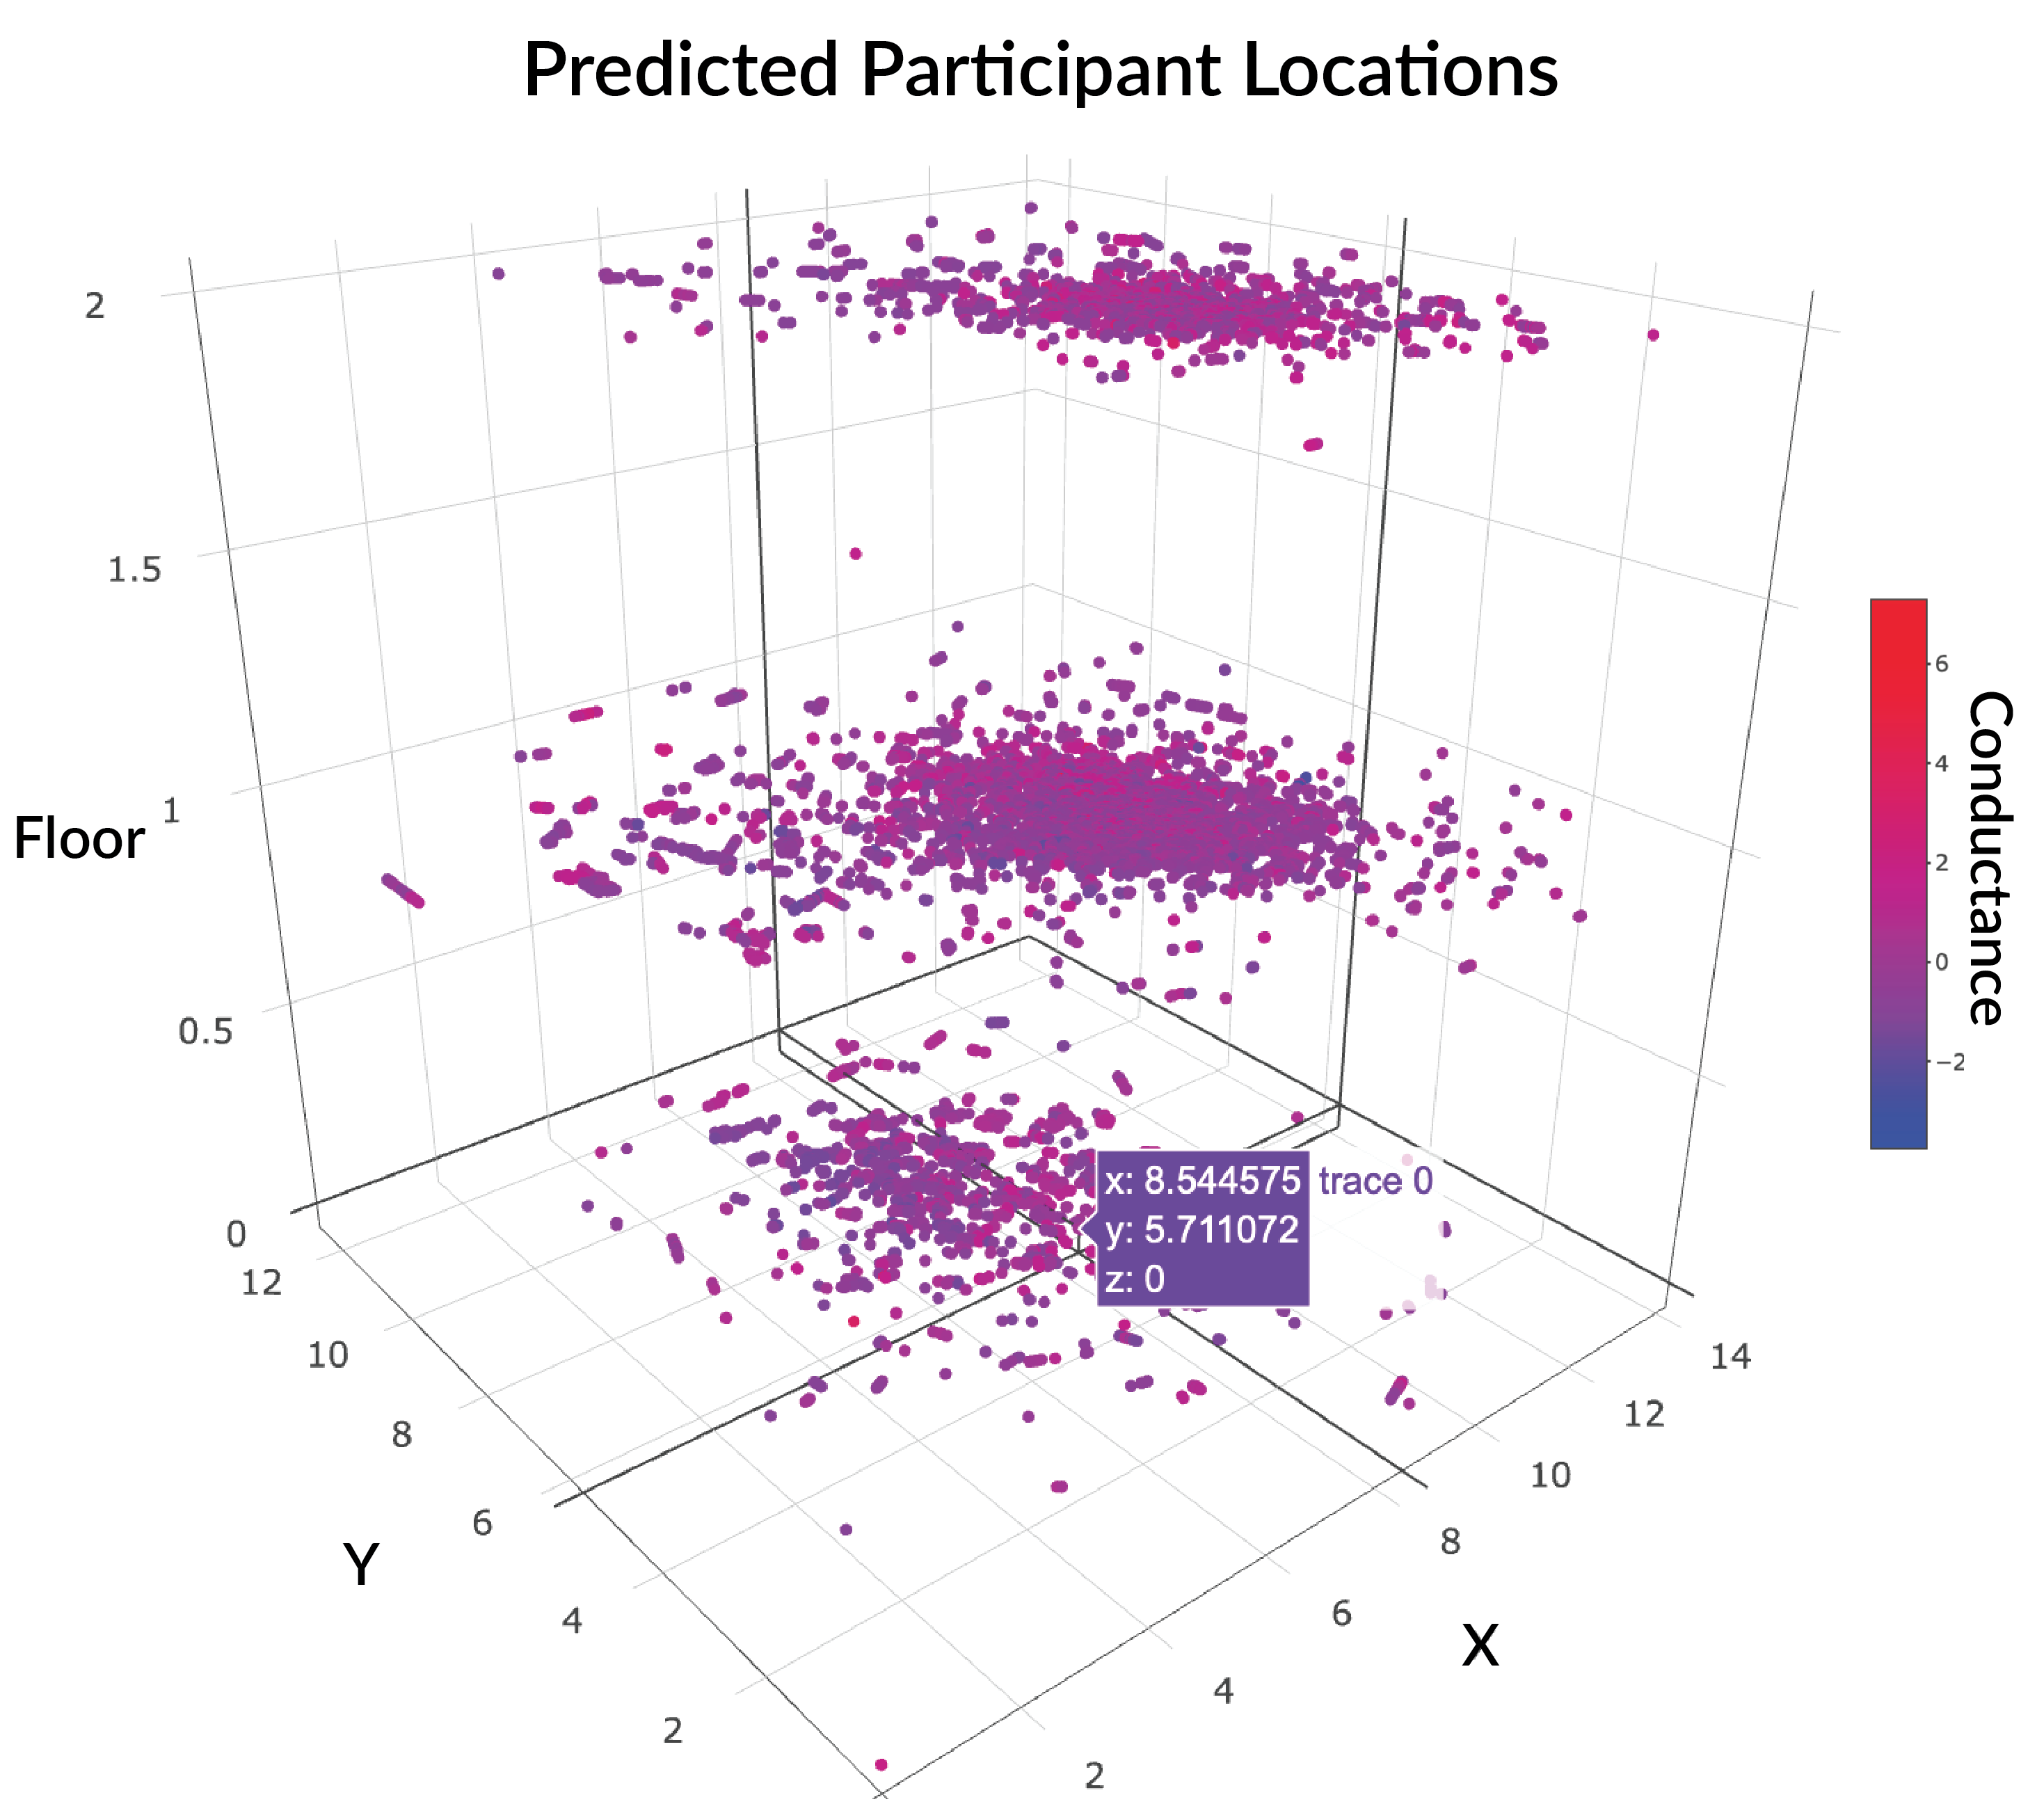
The prediction of indoor positions requires a reference set of data where the signal strength between a hand-held device such as a cellular phone and fixed access points (beacons) are measured at known locations throughout the building.
With these data, we can build a model for the location of a device asa function of signal strength between the device and each access point.
Predicted Locations & Conductance
resulting map of predictions
Software | Interactive Application
Your browser does not support the video tag.
Geospatial Application Emotion Musuem -
Uses a 3D model of a museum and geotagged emotion data to explore which exhibits in the Vincent Van Gogh Centre visitors find the most exciting.
Nurses' Health Study
Participants : ???
Sample population : healthcare workers
Variables :
risk factors for major chronic diseases
physical well-being
neighborhood walkability
conducted in partnership with Brigham and Women’s Hospital, which has been investigating risk factors for major chronic diseases since the 1970s.
Applying Methods to Commercial Smartwatches | Fitbit Data
Your browser does not support the video tag.
Ongoing Analytic Development: Mapping People Toolbox
What should be said about this?
Related Publications
Millar, G. C. ,
Mitas, O.,
Boode, W.,
Hoeke, L.,
de Kruijff, J.,
& Mitasova, H. (under review).
Space-time Analytics of Human Physiology for Urban Planning. ,
To be published as a Special Issue of: Computers, Environment and Urban Systems (CEUS).
Millar, G. C. ,
Mitas, O.,
Boode, W.,
Hoeke, L.,
de Kruijff, J.,
Tateosian, L.,
& Mitasova, H. (in preparation).
Stress3d: An Interactive & 3D Framework for Exploring Human Behavior .
Software & Applications
Geospatial Application Stress3d -
Uses cyclists' physiological data to see how stress and emotions can be affected by our environment.
Geospatial Application Emotion Musuem -
Uses a 3D model of a museum and geotagged emotion data to explore which exhibits in the Vincent Van Gogh Centre visitors find the most exciting.
Presentation Link: https://gcmillar.github.io/presentations/Harvard-CGA
Are speaking notes needed here?
Concluding Remarks
Your browser does not support the video tag.
Basically, what I hoped to be able to show you all today is how linking location and physiological data helps us contextualize and understand how people respond to their surrounding environment . . .
Because we, as people, don’t exist without our environment. Understanding that environment is therefore key to understanding, and optimizing, our emotional and physical well-being.
And if we can figure out how we respond to the environment, we can figure out a better way to live in it.
With that, I thank you all very much for your time. Now let's hear some questions...
Questions?
Your browser does not support the video tag.
